The smooth uninterrupted electronic services that sales and traders rely on to keep clients happy is dependent on much behind-the-scenes effort by IT teams. Monitoring of, and across, applications at every level of the IT stack is vital to be able to troubleshoot potential issues before they happen. Monitoring can be done in various environments and can create a plethora of metrics relating to any level of the IT stack depending on the tools used, but in this article, GreySpark and ITRS explain a concept that is growing increasingly important in the capital markets, Application Production Monitoring.
By GreySpark’s Rachel Lindstrom, Senior Manager

Over the last decade, IT estates within capital markets firms have grown enormously. Buy versus build decisions for firms have mostly come down to whether the firm felt that the platform or application it needed to replace had, or could, provide it with competitive advantage in trading. If it did not – and monitoring falls firmly into this category – the firm most often selected the cheaper option. This was often to buy a third-party vendor solution. The number of IT monitoring tools proliferated as a consequence, each with a slight twist on the offerings of its competitors, and choosing the optimal solution became more of a challenge. A sinuous, complex landscape of performance monitoring developed as a consequence in many firms.
Trading application monitoring, in particular, can generate reems of log files and other monitoring data that essentially obfuscates the real problems that IT teams need to focus on. A monitoring tool landscape that delivers duplicated metrics and omits useful metrics from other parts of the IT stack leaves IT teams struggling to discern why things have gone wrong in their trading application stack. For IT support teams attempting to identify issues before they escalate, too much data is almost as much of a challenge as too little.
What firms need, in many cases, is a holistic monitoring solution that can garner the necessary metrics at every layer of the IT stack in the production environment, organise the data into a form that helps firms prevent issues arising, rather than investigate them after the fact.
A term for this, growing in use across the industry, is Application Production Monitoring. This describes the holistic full-stack real-time monitoring of related applications, associated infrastructure and all the underlying components of the Open Systems Interconnection (OSI) stack to determine the overall health of the software and hardware relating to that application. Used by Support Teams and Application Owners in the production environment, the best Application Production Monitoring tools will draw this data together into one user-friendly dashboard.
Applications Performance Monitoring Versus Applications Production Monitoring
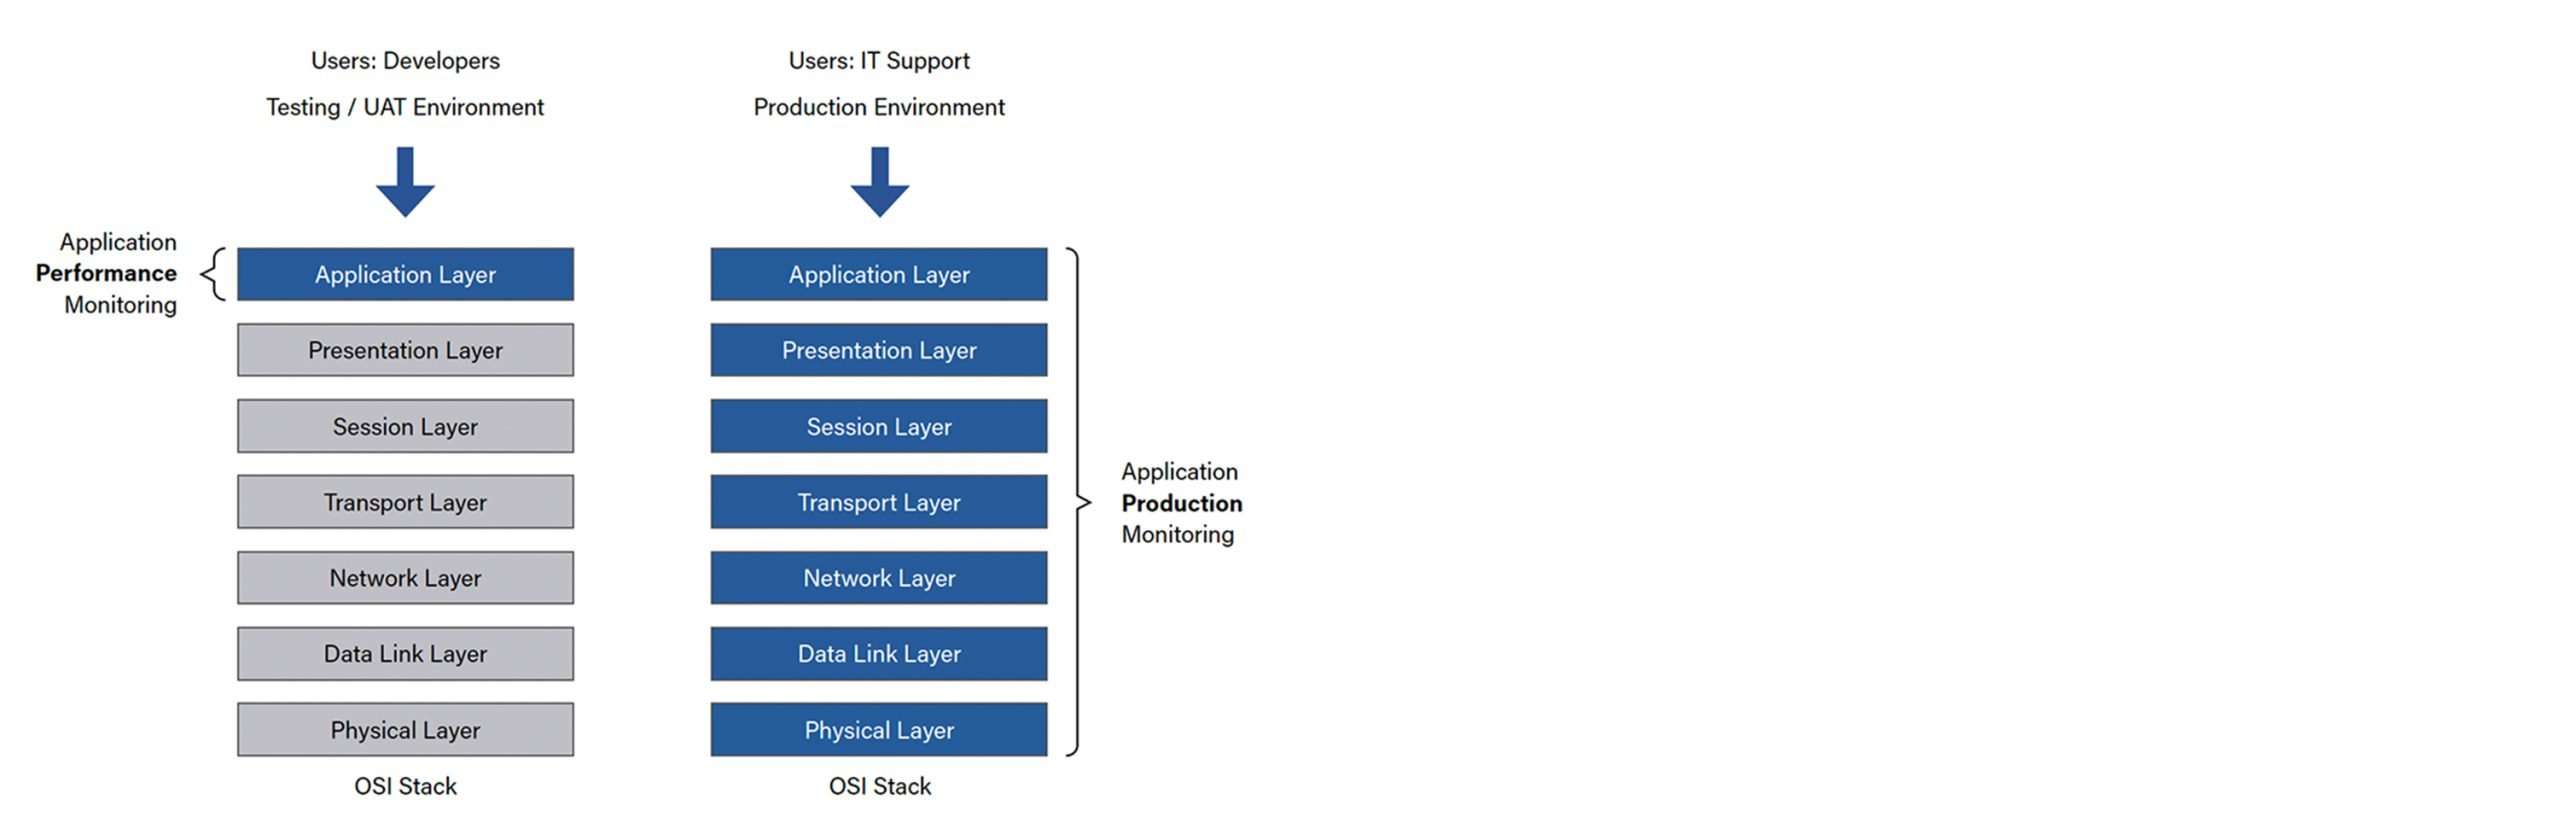
Application Performance Monitoring should not be confused with Application Production Monitoring (see Figure 1), as the former can refer to monitoring that delivers metrics relating to the performance of the application layer of an application’s OSI stack (see Figure 2). Application Performance Monitoring describes the monitoring of applications in staging or UAT environments to inform code reviews and optimisation. The metrics calculated are used primarily by development teams, DevOps and site reliability engineers (SREs) during the process of application development. Application Performance Monitoring tools create metrics on code-level performance of the runtime application architecture, client experience monitoring, business transactions and component monitoring. This approach has its place, but it does not allow full observability of the application and its dependencies in the production environment.

Figure 1: Application Performance Measurement Versus Application Production Measurement
Source: GreySpark analysis

(Click on image to enlarge)
Figure 2: Application Performance Measurement Versus Application Production Measurement in the OSI Stack
Source: GreySpark analysis
(Click on image to enlarge)
Many Application Performance Monitoring tools are designed for a particular type of technology. However, most capital markets firm IT enterprises are a mix of established and nascent technologies. This adds another level of complexity into the monitoring tools landscape in capital markets firms. One of the key differentiating technologies that impacts how monitoring is achieved are single code base – also termed, monolithic – applications versus microservices-architected applications.
- Microservices-based Application Monitoring – Developed and maintained using a DevOps approach, typically, wherein a microservice is worked on in a development and test environment and is swapped into the production environment when the upgrade is ready. Application Performance Monitoring would be an appropriate tool for DevOps teams to use while the microservice is in the development and test environments. Application Production Monitoring, however, comes into its own when the application is in the production environment.
- Monolithic Application Monitoring – A significant proportion of the established technology estate in capital markets firms was developed using a single code base. This means that Application Performance Monitoring is mostly undertaken when the application is shut down for an upgrade and only the bare minimum of monitoring is undertaken in the production environment. This is because monitoring undertaken in a production environment can have a significant impact on the performance of the application the tool is monitoring.
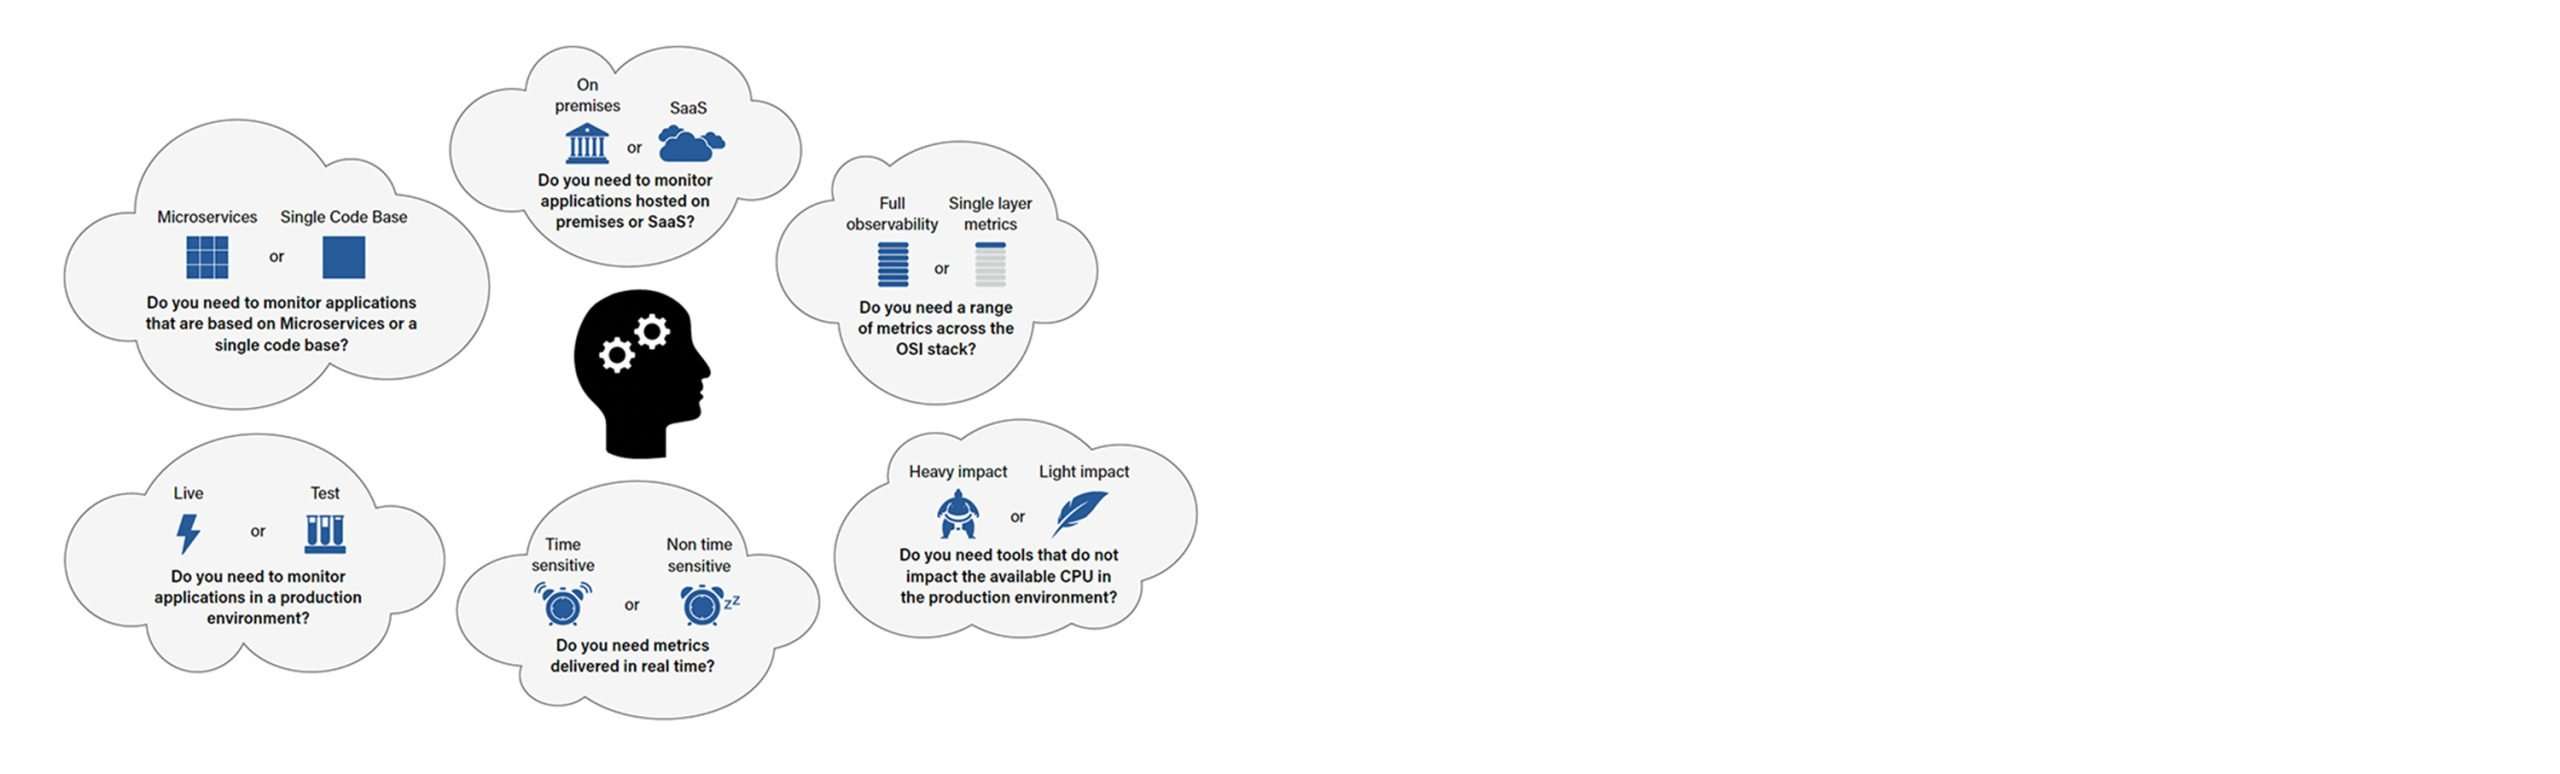
Figure 3: Considerations When Choosing Tools to Measure Your Applications
Source: GreySpark analysis
(Click on image to enlarge)
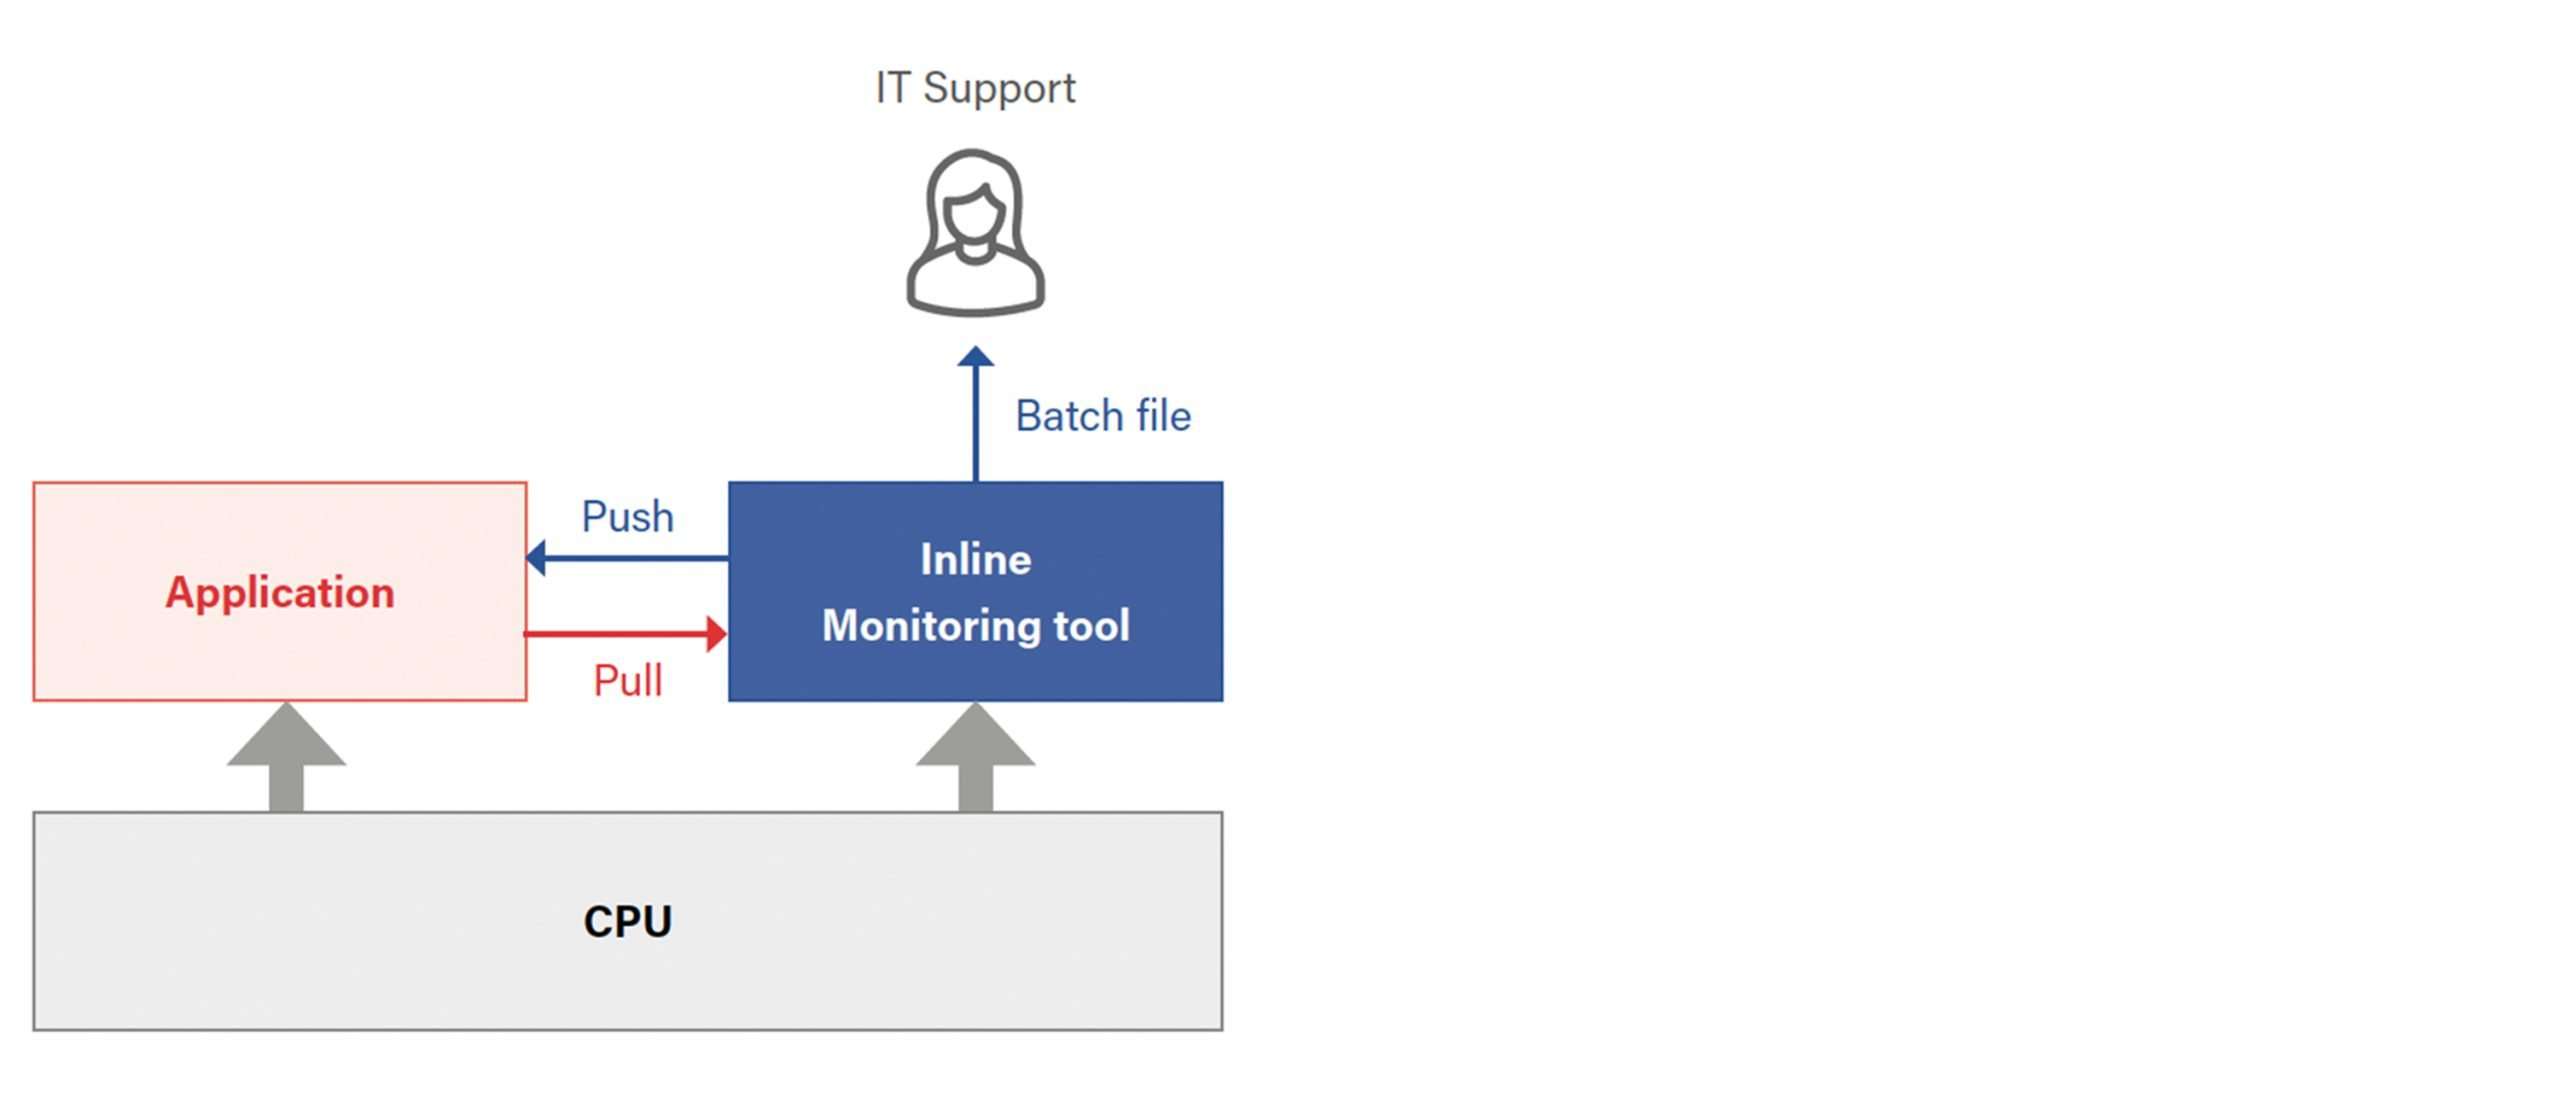
Application Production Monitoring, which takes place in the production environment, drawing together many different metrics, must, therefore, be architected to have as little impact as possible on application’s performance. If a monitoring tool needs access to the application’s software code, or takes up hardware bandwidth, it will impact the performance of the application (see Figure 4). To address this, firms require a monitoring solution with a light footprint and unobtrusive data collection tools.
Figure 4: CPU-hungry Inline Monitoring Tool Sending Metrics in a Batch File
Source: GreySpark analysis
(Click on image to enlarge)
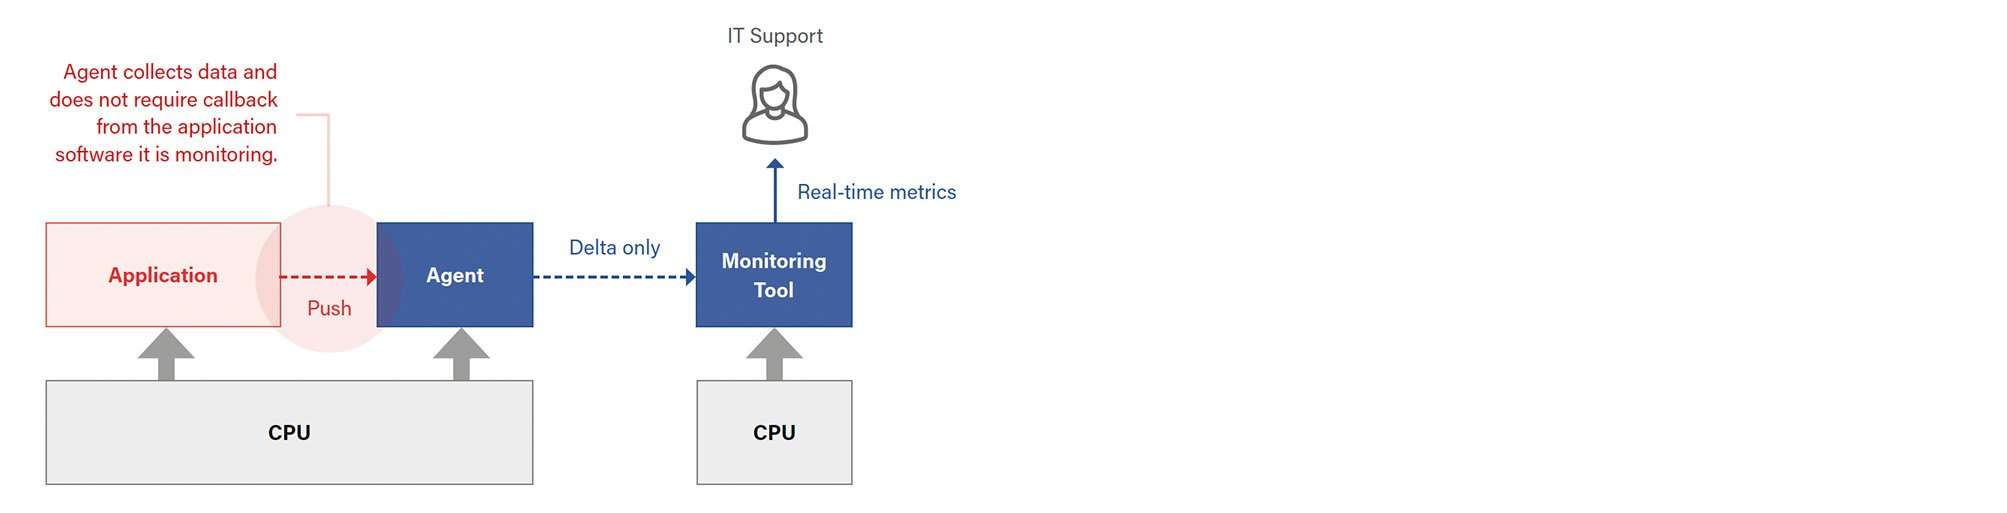
Rather than monitoring a component using an inline monitoring tool, an ‘agent’ is used to send only data that changes (the ‘delta’) to a monitoring tool that runs on a separate server. This means that the monitoring tool does not adversely affect the performance of the component and is able to undertake analysis on the data using the compute power of a separate dedicated server (see Figure 5).
Figure 5: Lightweight Inline Agent Sending Changes in Metrics only to Monitoring Tool in Real Time
Source: GreySpark analysis
(Click on image to enlarge)
To ensure that their existing systems stay up and running, capital markets firms need monitoring tools deployed in the production environment that can measure application metrics regardless of whether they are maintained in a DevOps environment or as a single code base. The monitoring tools need to provide real-time metrics to ascertain the health of the whole of the OSI stack of the application and its dependencies. In other words, capital markets firms need Application Production Monitoring tools.
Not All Real-time Monitoring is Created Equal
While not all trading is low latency, across the financial services, trading of all types is becoming increasingly fast. Although some traders will trade only once a day, high frequency trading (HFT) applications can execute large numbers of orders per second. The IT estate that supports the trading business – whether HFT or not – needs to be able to identify issues before they become critical. This means that performance and availability monitoring, as well as alerting, must be real-time, too. If metrics are sent in batches or as delayed data, the time for any issue to be resolved is extended by the length of the delay of the data. The issue – perhaps a trading application outage – brings both reputational damage and a negative financial impact on the business.
Trade application monitoring requires the polling of software services at a frequency of the order of human response time – in other words seconds. To ensure trading applications are healthy, all the technology components below it in the OSI stack must be monitored in real time, too, including market data feeds, reference data, network latency and trade protocols such as FIX.
There are many reasons why a monitoring tool may not be able to get relevant metrics to IT Support in real time. The first is, of course, that the tool has been architected to send metrics in batch files. Wherever this delay is introduced – in the data gathering or analysis – there will be a delay in any remediating action. Another reason could be that the server on which the monitoring tool is deployed does not have sufficient available compute power to create and analyse data in real time.
In the former case, IT Support will know to expect a delay between an issue arising and an alert being sent and can put controls and other mitigations in place to alleviate the worst potential consequences, but in the latter, IT support may labour under the misapprehension that the monitoring tool they are using is operating in real time, and a false sense of confidence in the technology. This is something that needs to be considered and assessed carefully when a capital markets firm chooses a Application Production Monitoring tool for any particular application stack.
Futureproof Your Approach with Holistic Observability
Trade application management teams are constantly evolving their trading stack by assessing new technologies as they look to improve performance or reduce costs. Each change that is made alters the level of risk. If, for instance, some of the trading stack is migrated from on-premises hardware to be deployed in the cloud the risk level for the business changes and, as such, implementing a monitoring tool that can help to mitigate some of that risk.
Capital markets firms looking to enhance the observability of their trading IT estate should look for a trade application monitoring solution that incorporates all the monitoring plug-ins needed for the future, regardless of the technology they use in the next decade. Risk is implicit in every component and every decision and for firms to thrive, it is imperative to reduce risk as much as possible. Reviewing the monitoring landscape will become a must. Multiple monitoring solutions that, between them, fail to cover the entire OSI stack and can only monitor in the development environment, or present a serious drain on application performance in the production environment, must become a thing of the past. Even so, legacy technology is often so deeply embedded in capital markets firms that it will be part of their IT estate for the foreseeable future and, so, monitoring solutions must be able to monitor and alert on both the new and old technology.
Having real-time visibility of an application stack’s performance in production on one dashboard – or, on a single pane of glass in an immediately understandable context – ensures that should the worst happen, teams can identify quickly where the issue lies and move to resolution as quickly as possible, too. Ideally, monitoring tools would also rank and highlight the places that need attention and even fix the smaller issues automatically, without the need for human intervention. Having these tools available to them means that capital markets firms will have achieved a ‘nirvana’ of monitoring; 360 degree observability of their application stacks.
ITRS Geneos empowers financial services with real-time IT monitoring and alerting. It enables them to gain a competitive advantage from IT performance and drives resilient operations, delivering intelligent insights that reduce the business impact of outages and application issues in production. ITRS Geneos supports the most diverse and interconnected IT estates at scale without impacting system performance. It monitors transactions, processes, applications, and infrastructure across on-premises, cloud, and highly dynamic containerized environments, giving financial services full control over IT ecosystems and ensuring minimal latency 24×7. ITRS Geneos ensures the quality and validity of market data and helps minimize the latency of data feeds, powering highly informed trading decisions and strengthening the relationship between market data providers and the trading ecosystem.